


By Michael Lovegren of Kinetic Loop Training System
The future of cycling depends on the youth of today and I believe that with the technology of "power based training" we can create the future pro cyclists of tomorrow. Through power based training we can prevent today’s youth* from over training, burn out, and sports related injuries to create, in turn, more efficient and smarter cyclists.
Power Based Training for Junior Cyclists
I hear this all the time, "Why should my son or daughter train with a power meter?" My response to parents is to ask, "How are you measuring, managing, and helping your junior peak and taper for their event?"
I have been coaching juniors since 2004 and am the Head Coach for the KLTS Junior Development Team.With the power meter you can learn a lot from the data by looking at the Chronic Training Load (CTL), Training Stress Score (TSS), and the Acute Training Load (ATL).Plus a cycling power meter provides live feedback from a junior cyclist so we can see how they are responding to the training stimulus.
Let's face it, coaching is both an art and science. Each junior responds differently to the training load and what you would do with an 8 year old cyclist, you would not do with a 15 year old cyclist.The power meter is the truth detector that allows you to see how hard your junior is training. Once a junior has a power meter on their bike the best advice is to have them go ride and race to obtain data. The data will help you create a baseline and provide a road map to help the junior cyclists improve.
Determine Your Juniors Strengths and Weaknesses
Once a junior cyclist has begun training and racing with a cycling power meter, you can now determine their strengths and weakness. By analyzing their power data, you’re able to calculate how many matches your junior burned during the race.For example, let’s say that your junior had an average power of 200 watts and a normalized power of 225 watts for a 30 minute criterium and took 3rd in the race. You can take that information and help your junior create a training adaptation that leaves them with more gas in his/her tank.
Cornering Smooth
Cornering is an art that most juniors, and a few professional cyclists, have a hard time mastering. When analyzing the data from a junior’s criterium race you might see spikes in power and changes in cadence.These power spikes are likely indicative of when a junior forgets to pedal through the corner, or maybe forgetting to shift before going into the turn, which resulted in the junior coming out of the turn over-geared.By analyzing a junior’s criterium file you can see how many spikes, also referred to as "matches," are burned from each turn. These spikes from cornering are considered wasted energy, or matches burned, during the race. They key is to teach a junior bike handling skills, both slow speed and fast speed drills, and they will be able to conserve energy and win their race.
Slow and Fast Speed Drills for Juniors
With our junior development team we teach our juniors slow speed and fast speed drills.
Power Profile
Tracking a juniors power data can allow you to determine their Power Profile. The power profile compares your juniors 5 second, 1 minute, 5 minute and 1 hour max power compared to other adult riders or professional cyclists. With the power profile completed you are able to view the junior’s strengths and weakness and help them improve.A junior with a high 5 second or 1 minute would be classified as a Sprinter.A junior with a high 5 minute and 1 hour would be classified as a Climber or Time Trialist.You can see that from the profile below that this particular junior athlete’s strengths are time trial and climbing. This junior has an FTP of 250 watts and a body weight of 116 pounds, his power to weight ratio is 4.80 watts/kg. 
Mean Maximal Chart
The mean maximal chart is a power-to-time ratio chart.With these charts you can look at your juniors progress from year-to-year or his/her current season compared to the last 28 days. This is a great way to help show your junior how they are progressing.Some seasons your junior will have his/her worst season, but will still have personal best max powers.That is okay because you can help show him/her that they are getting stronger with their power data and help them learn how to read the race. Just take a look at the charts below, you can see a year to year comparison and improvements in power. 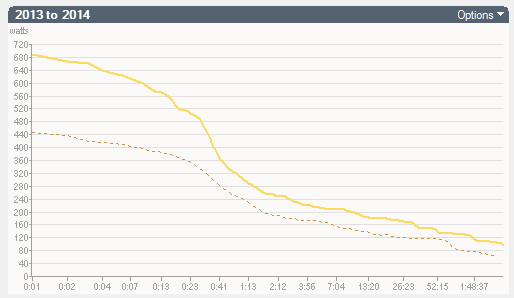
Solid line = 2014; Dotted line = 2013 
Solid line = 2013; Dotted line = 2012
Remember to make it fun when training junior athletes, set small, frequent goals, and make their progress visible to them by using a power meter.As I’ve experienced with my juniors, a cycling power meter is a truth detector and great motivator for juniors.
*USA Cycling defines youth as ages 6 to 8 years old and juniors are defined as 9 to 18 years old.
![]()
Michael Lovegren M.S. in Biomechanics is a USA Cycling Level1 Cycling Coach and founder of Kinetic Loop Training System. Michael is the Head Coach/Team Director for the Kinetic Loop Training System Junior Development Team.


